
May 29, 2026
Cult Classics in Tableau
I'm taking a data visualization course for serious people, and I am currently deciding just how far I want to dive into the topic of cult classics. I'm learning Tableau, which allows you to drag and
drop your data and create charts and graphs. My classmates may be the type to lean toward STEM in general, but I am the type to lean into the arts. So, of course, I am using this as an opportunity to make some fun charts about movies. I'm excited to share them here when they're done!
For now, enjoy my first cult classics Tableau visualization:
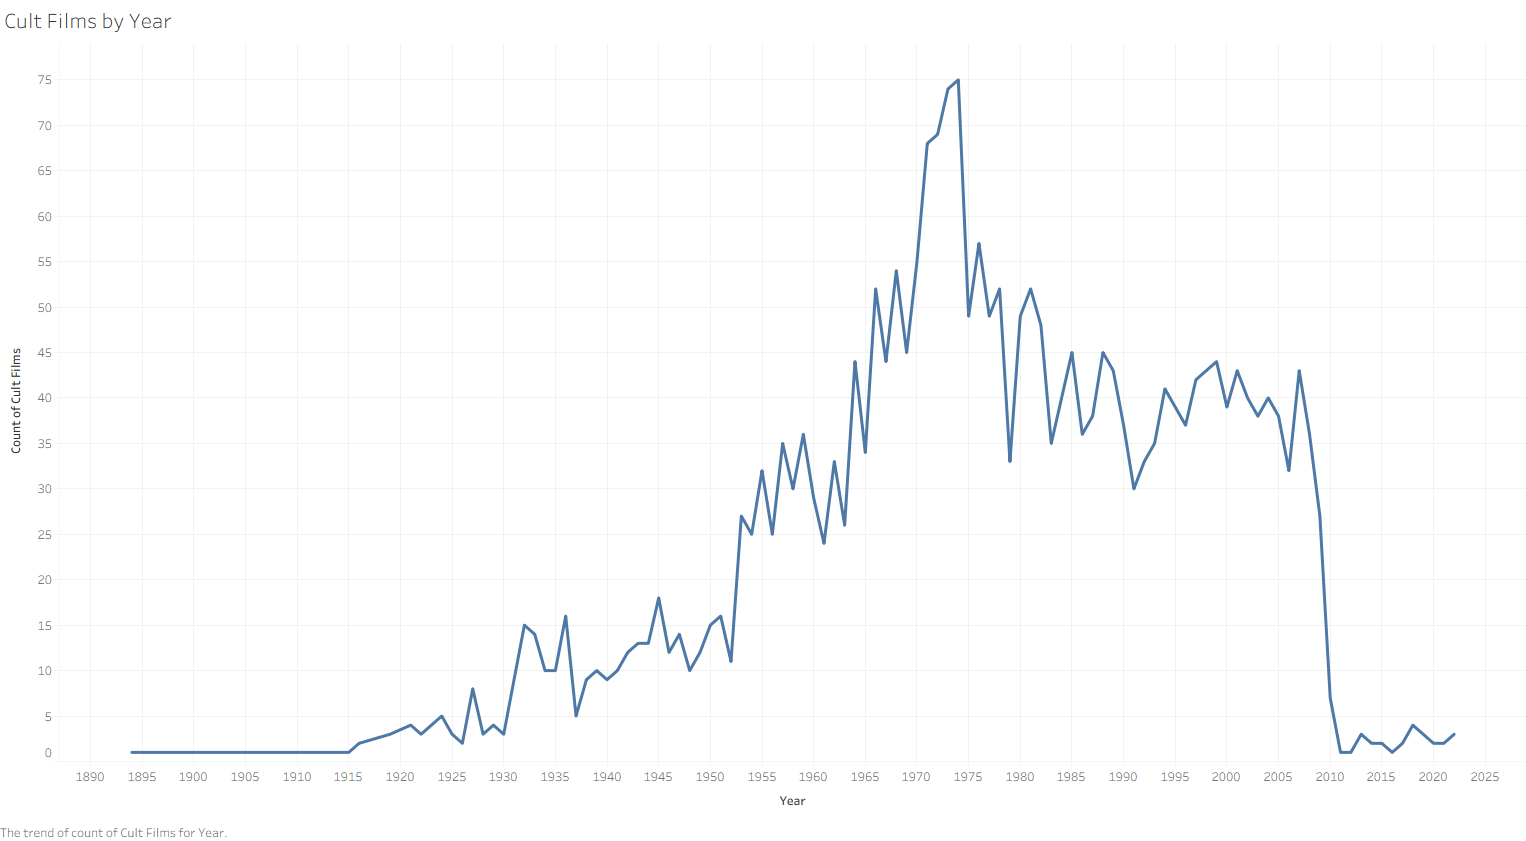
Now, I know what you're thinking. "Lilune, why is this visualization so hard to read?"

You haven't hovered on the image
I am not that good yet at Tableau
You forgot you can open it in a new tab
You're closing your eyes a little too much
I'll keep working away -- don't worry. I have a whole class to learn, and I'm sure I'm going to have loads more to show you as time goes on.